Lesson 7 — Histograms & Tonal Mapping: Reading the Hidden Story
Histogram tonal mapping reveals how light is distributed in your image—from deep shadows to bright highlights. When you learn to read it fluently, exposure becomes objective, contrast becomes intentional, and editing becomes controlled rather than reactive.
Learning Objectives
- Understand how histograms represent tonal distribution.
- Recognize clipping, underexposure, overexposure, and contrast patterns.
- Use tonal mapping to guide editing decisions.
- Interpret histograms in both camera and post-production contexts.
1) What a Histogram Really Shows
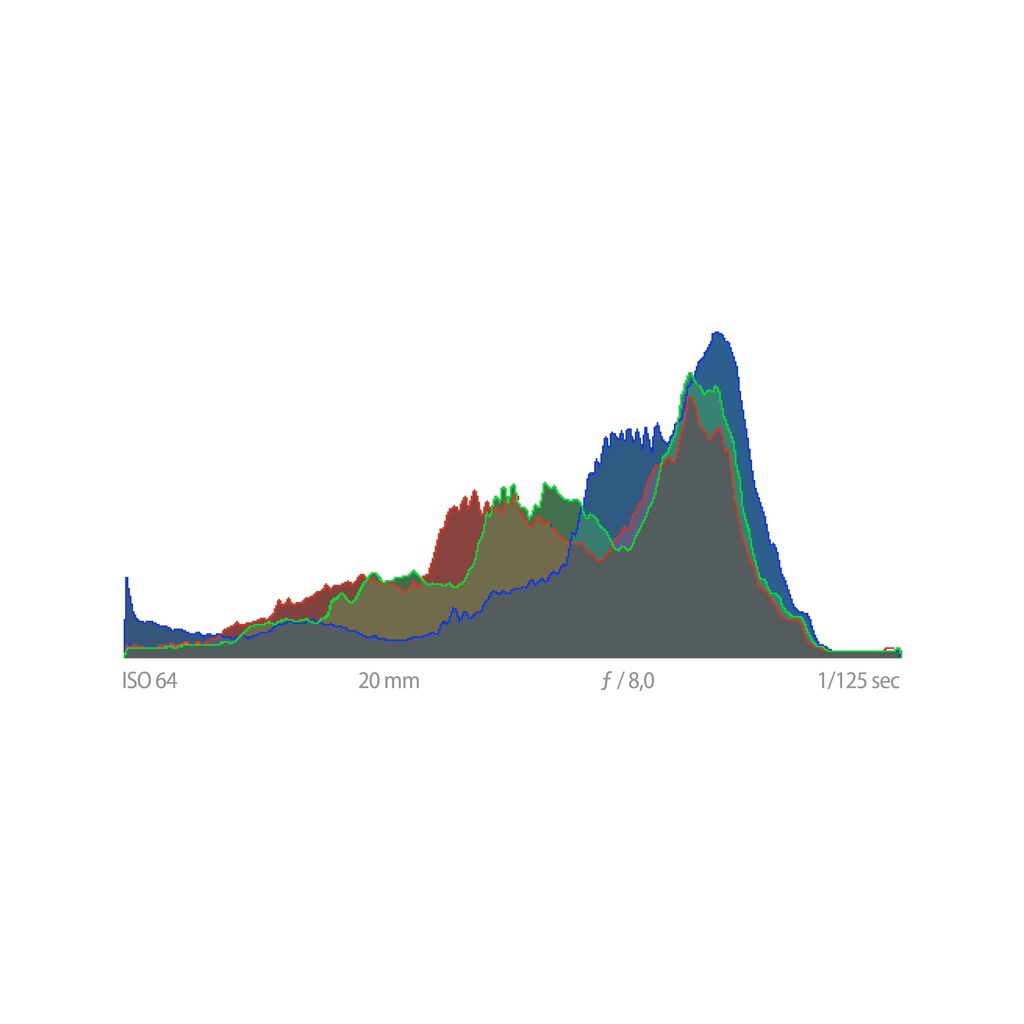
A histogram is a graph of brightness values in your image. The left side represents shadows, the middle represents midtones, and the right represents highlights. Peaks reveal where most tonal data is concentrated.
2) The Three Most Common Histogram Shapes
- Low-key histogram — values lean left; rich shadows and dramatic mood.
- High-key histogram — values lean right; bright tones and airy feel.
- Balanced histogram — tones spread across the range; natural contrast.
3) Clipping — The Point of No Return
When tones pile up at the far ends of the graph, they are clipped. Clipping means detail is lost and cannot be recovered.
- Shadow clipping (left edge) — loss of detail in dark areas.
- Highlight clipping (right edge) — pure white without texture.
For a foundational review of exposure mechanics, revisit Lesson 4 — The Exposure Triangle.
4) Tonal Mapping — Sculpting the Photograph
Tonal mapping is the deliberate shaping of the image’s brightness distribution. Tools such as Curves, Levels, Highlights/Shadows, Blacks/Whites, and Local Masks allow you to mold tone precisely. In practice, histogram tonal mapping gives structure to your editing decisions.
5) RGB Histograms — Seeing Color as Tone
RGB histograms reveal color-channel clipping. Often, red, green, or blue channels clip before the overall luminance histogram does. Therefore, checking RGB channels protects subtle color detail that may otherwise disappear.
6) Practical Photography Applications
In the field, histograms help you protect highlights, evaluate contrast, and confirm exposure under bright or misleading lighting conditions. In editing, they guide tonal mapping decisions objectively.
Hands-On: Three Histogram Exposures
- Baseline: Centered histogram, no obvious clipping.
- Protect highlights: −1 stop, right edge pulls away.
- Lift shadows: +1 stop, watch carefully for highlight clipping.
Quick Check
- What do the left, middle, and right sides of a histogram represent?
- Why is highlight clipping often more damaging than shadow clipping?
- What can RGB histograms reveal that luminance alone may hide?
Glossary
- Histogram
- A graph showing tonal distribution from shadows to highlights.
- Clipping
- Loss of detail at pure black or pure white extremes.
- Midtones
- The tonal range between shadows and highlights.
- Tonal Mapping
- Shaping brightness distribution using global and local adjustments.
- RGB Histogram
- Separate channel histograms that reveal color-channel clipping.
Continue in Learn → View all Learn lessons
Jump to: Learn Envision Create
References
- Adobe — Histogram Basics
- Associated blog: Lesson 4 — The Exposure Triangle
- Associated blog: Lesson 6 — The Physics of Vision: Why the Eye Loves Contrast